-
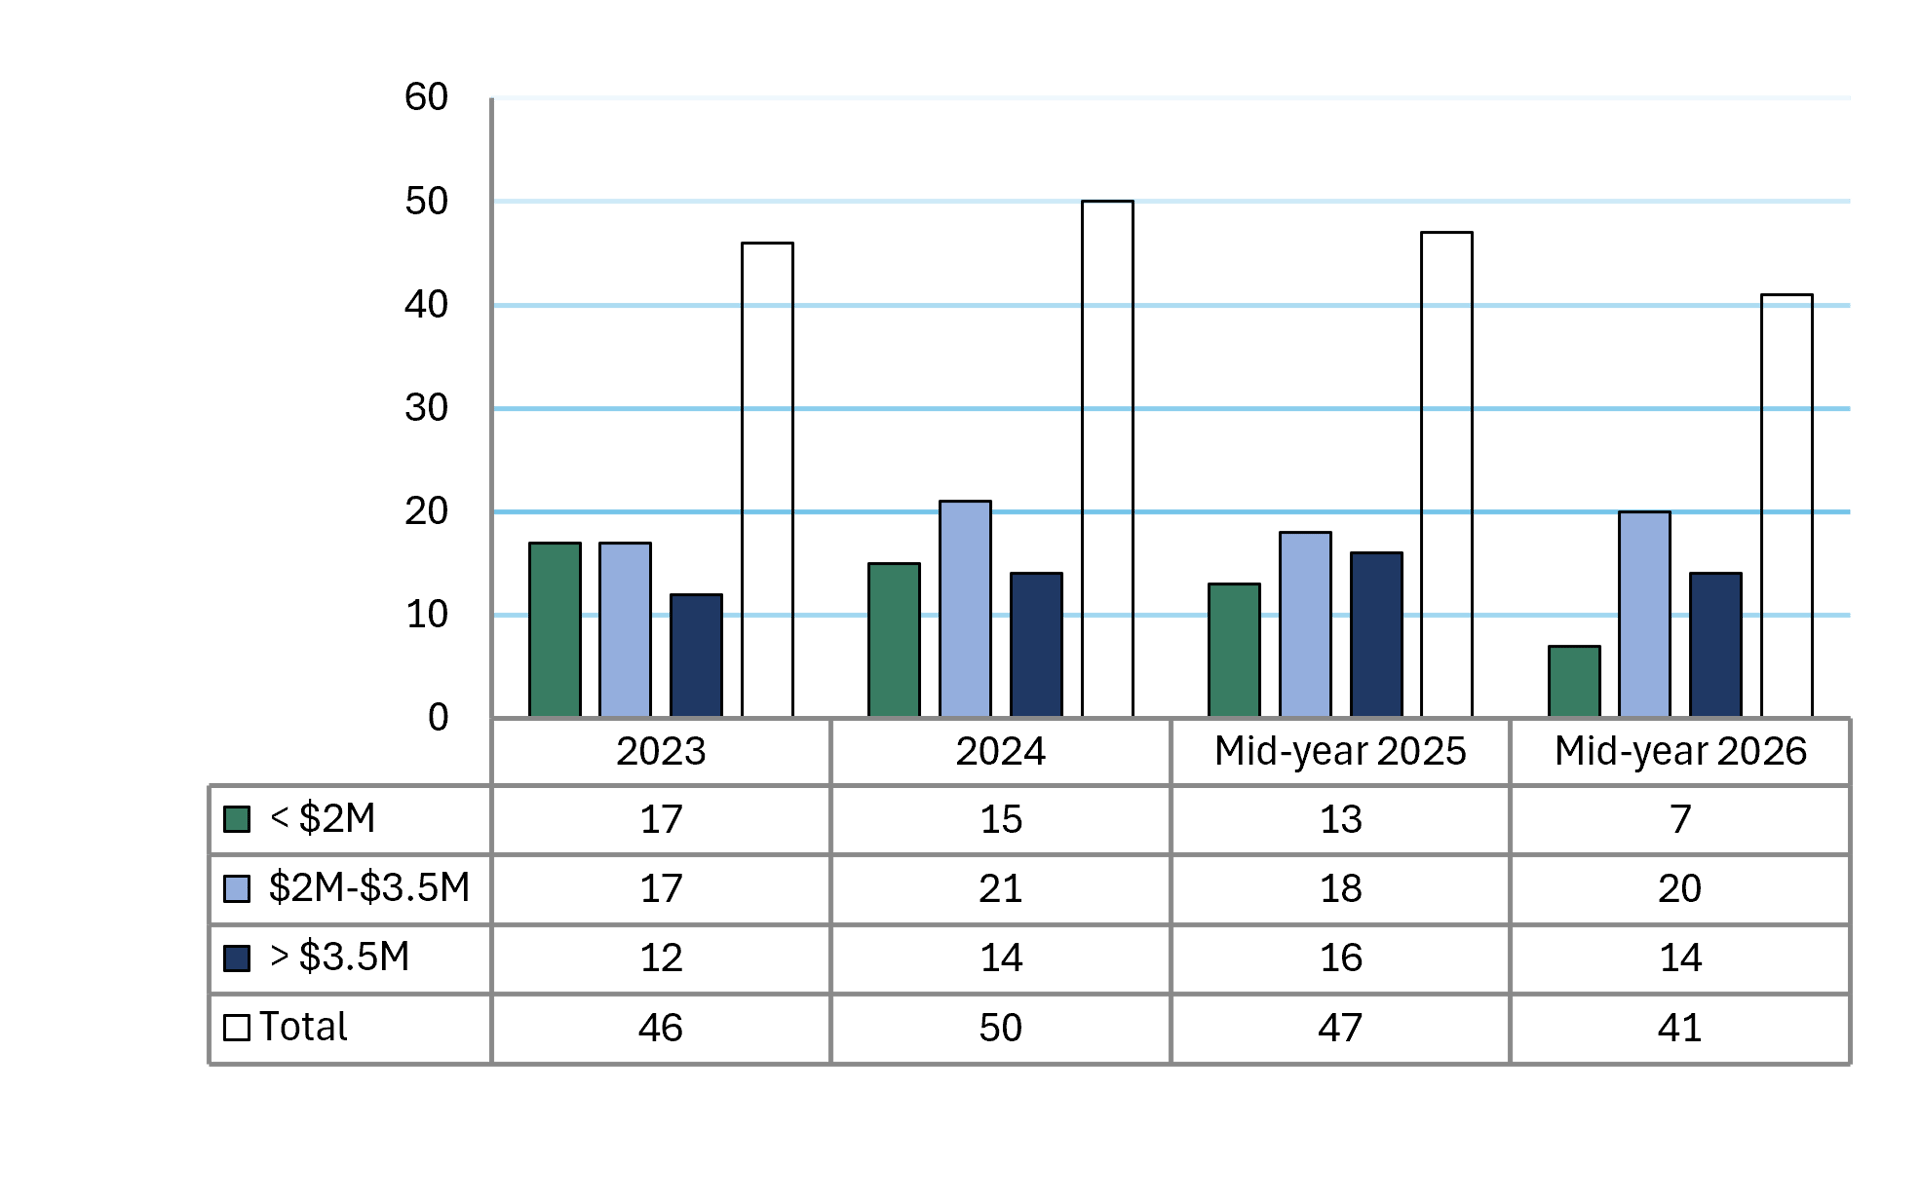
NUMBER OF HOMES SOLD
-
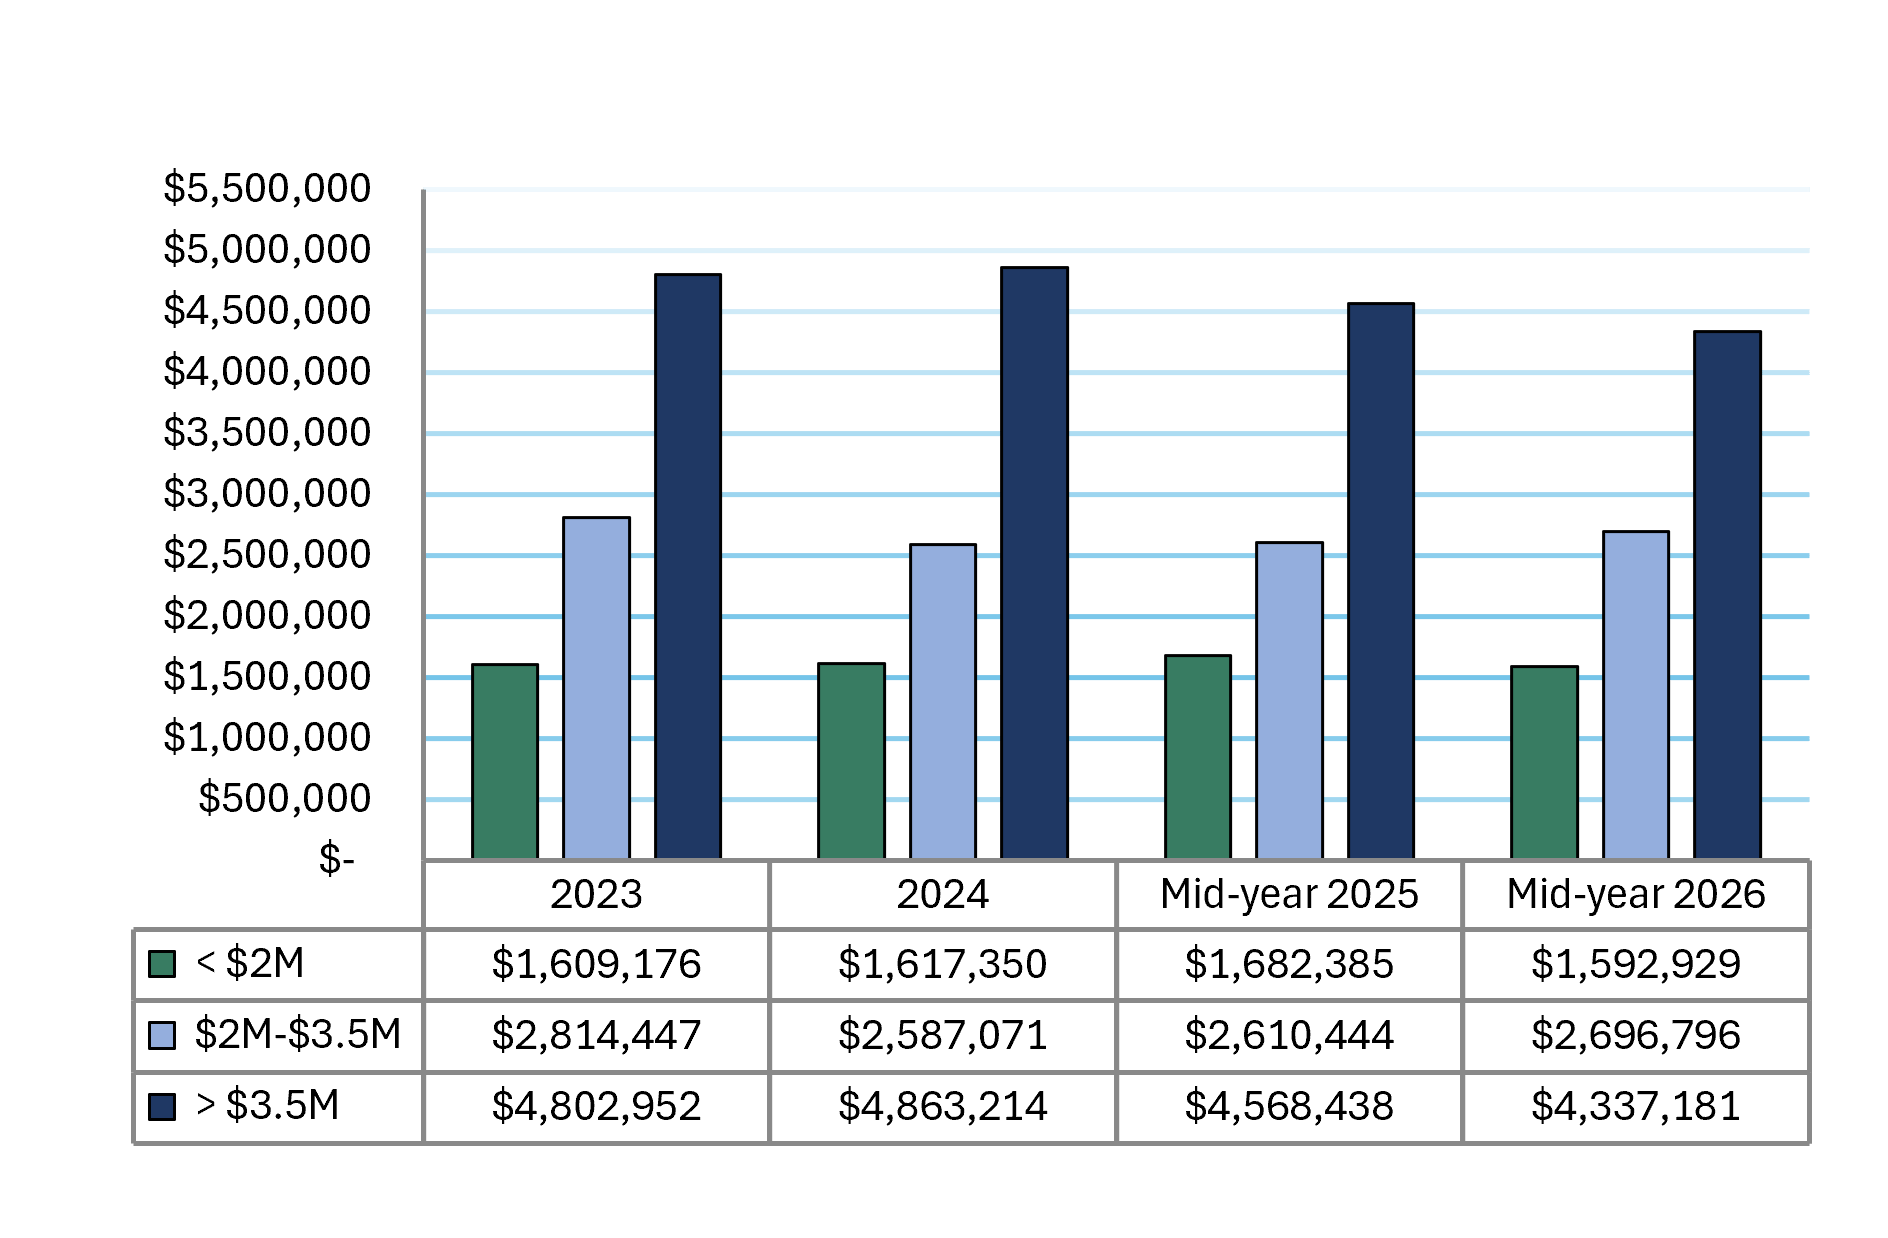
AVERAGE Home sold PRICE
-
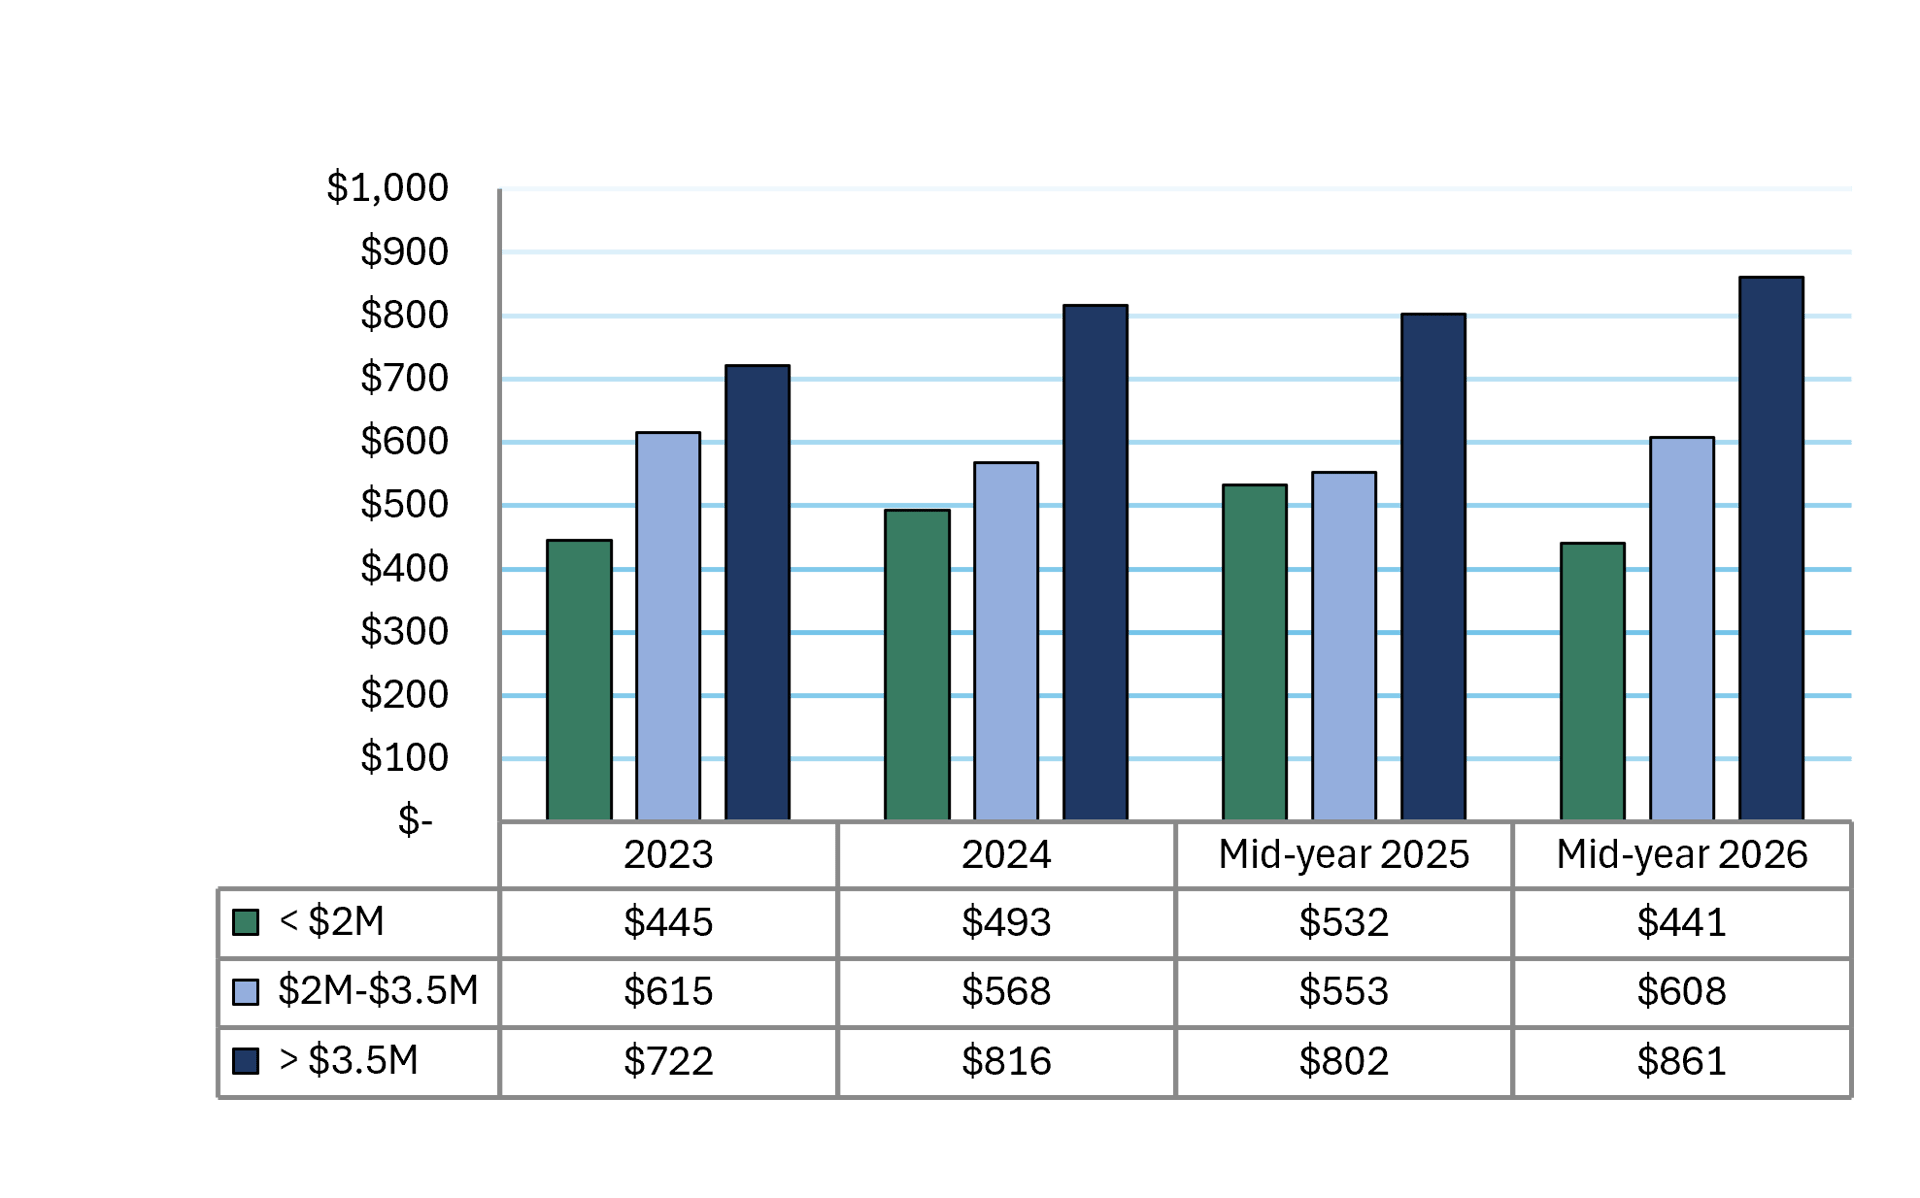
Average Price Per Square Foot(PPSF)
-
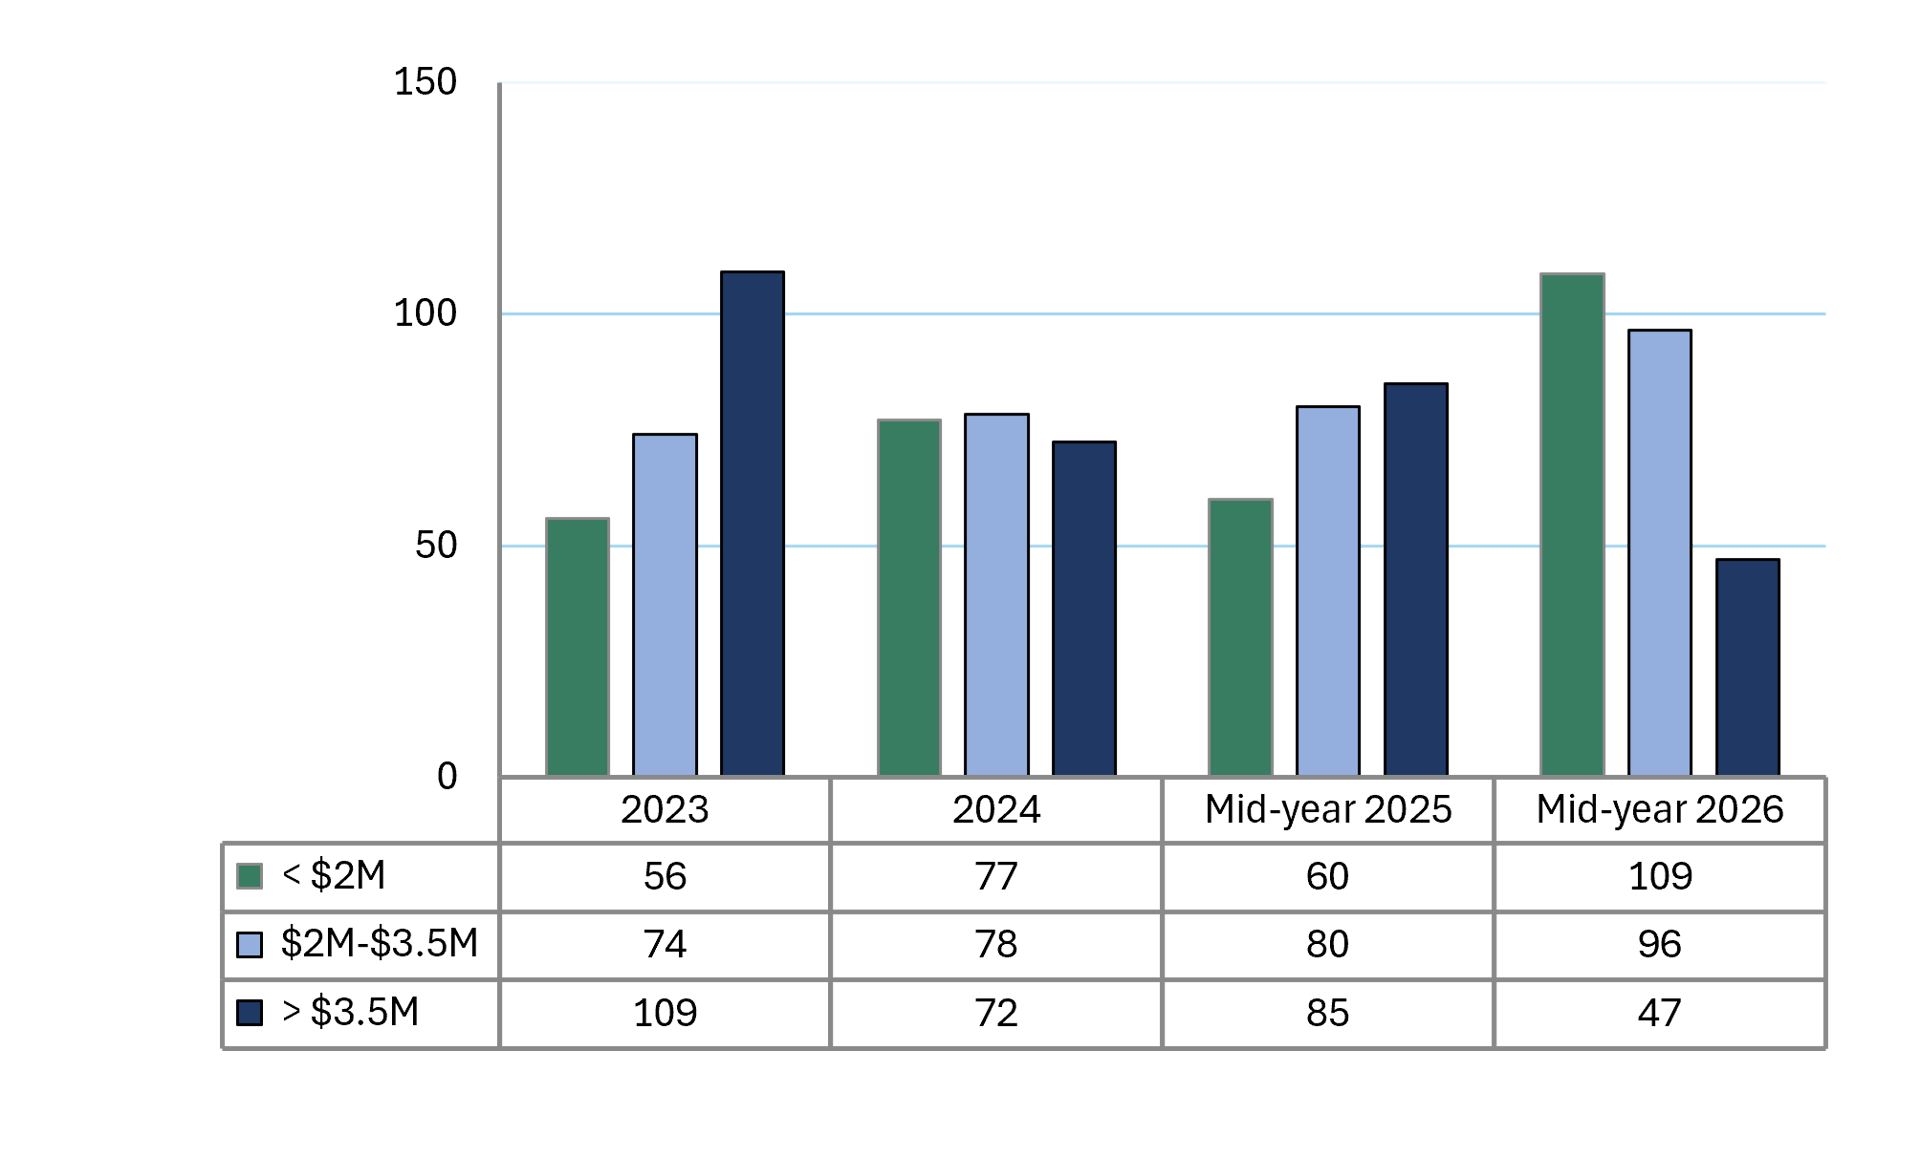
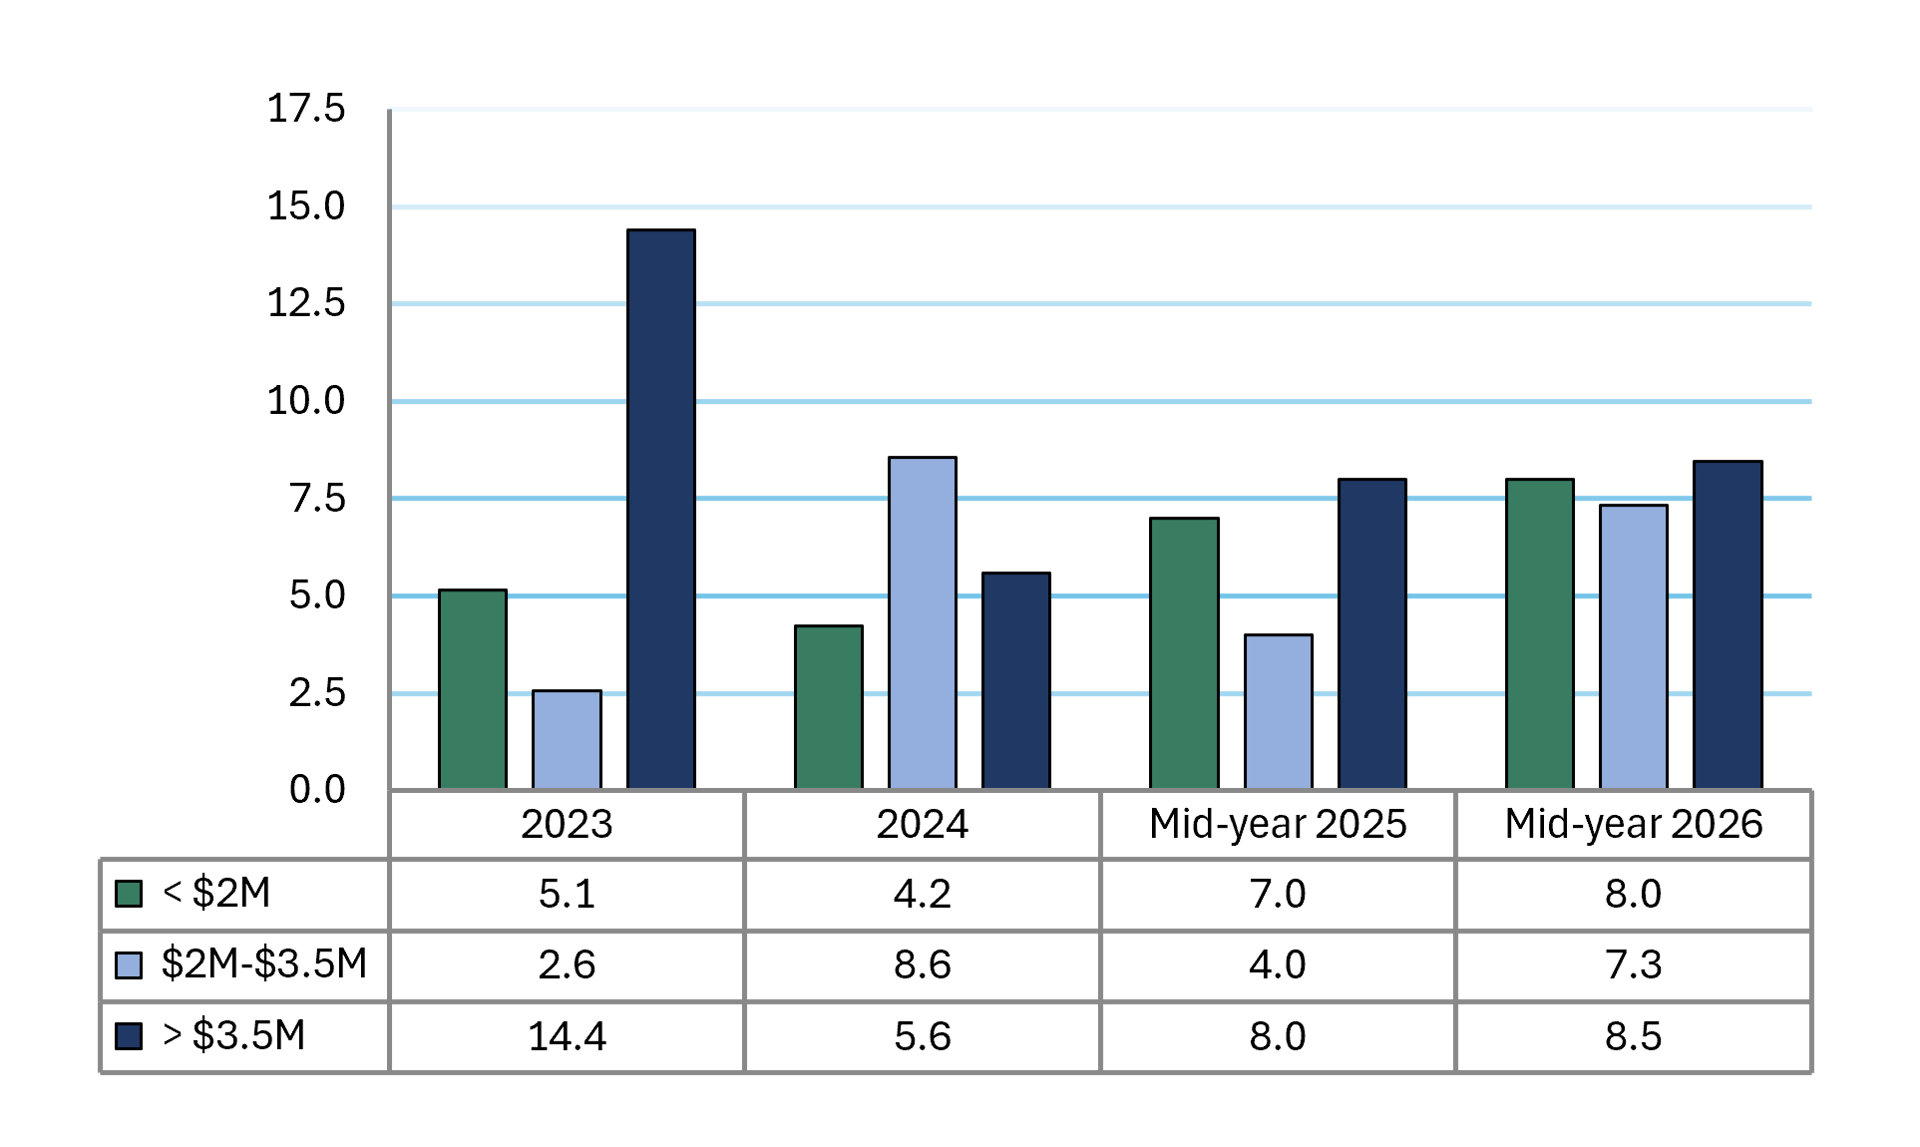
Average Months of Inventory(AMOI)
-
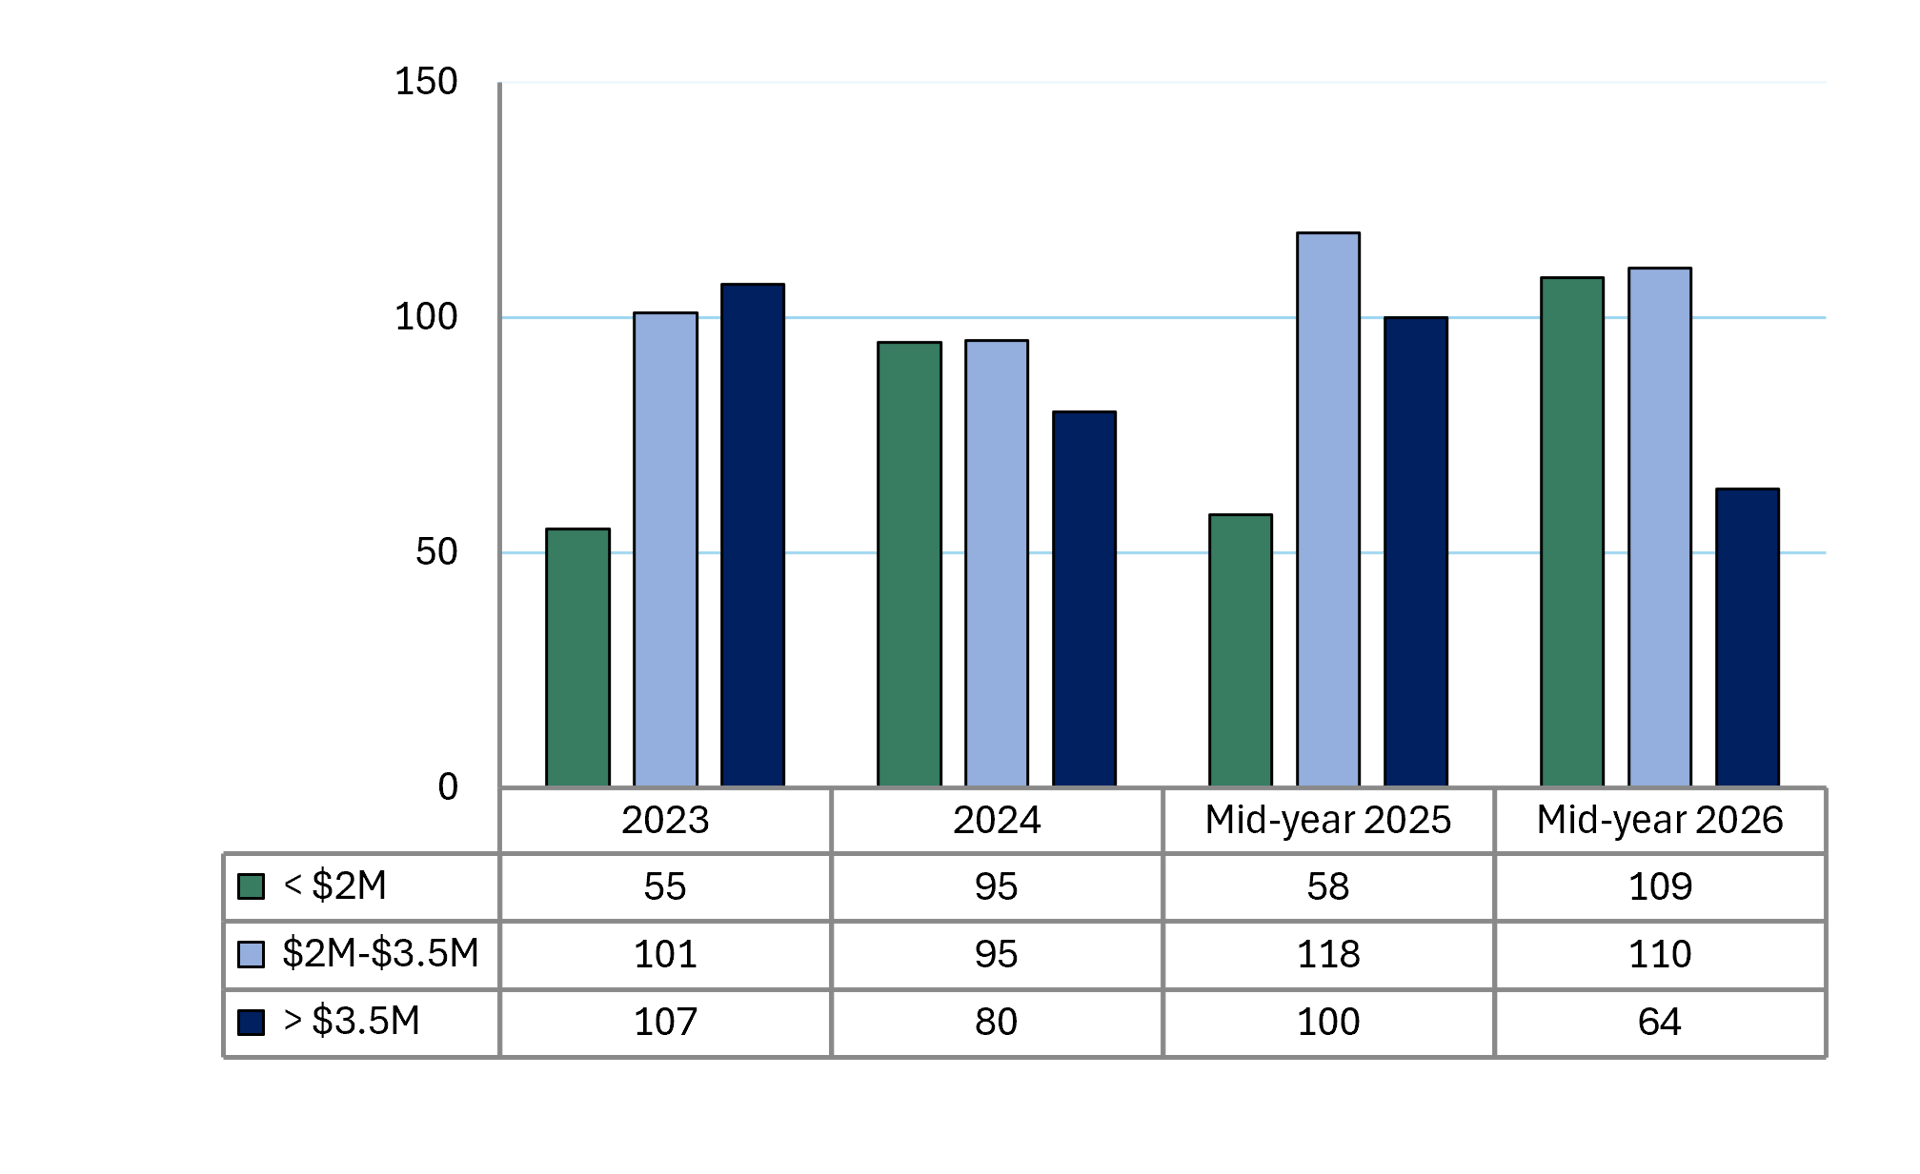
Average Days on Market(ADOM)
-
Cumulative Days on Market(CDOM)
Our Mid-Year Market Reports provide quarterly and year-over-year analysis of West Austin and Lakeway's premier neighborhoods, including Lost Creek, Rob Roy, Seven Oaks, Barton Creek West, Rollingwood and other neighborhoods. Most reports feature market specific metrics, market trends, and key indicators such as home prices, price per square foot, months of inventory, average days on market, and cumulative days on market. Use the index below to explore reports by neighborhood and market segment.
Rolling Four Quarters (R4 QTRS) measures the most recent 12 months of market activity, helping smooth seasonal fluctuations and providing a clearer view of underlying market trends. For Mid-Year reports, Mid-Year 2026 is compared to Mid-Year 2025 using the prior four quarters ending June 30 for each period. We also reference previous year-end market data to provide additional context and perspective on longer-term trends.
Download a Full Market Area Report including Average and Median Price Per Square Foot (PPSF), Median Home Prices for the area, Cumulative Days on Market (CDOM), and a peak at the Private Market.